Fluorescence microscopy

Description

EPySeg is a package for segmenting 2D epithelial tissues. EPySeg also ships with a graphical user interface that allows for building, training and running deep learning models.

Training can be done with or without data augmentation (2D-xy and 3D-xyz data augmentation are supported). EPySeg relies on the segmentation_models library. EPySeg source code is available here. Cloud version available here.

has function
need a thumbnail
Description

Fast4DReg is a Fiji macro for drift correction for 2D and 3D video and is able to correct drift in all x-, y- and/or z-directions. Fast4DReg creates intensity projections along both axes and estimates their drift using cross-correlation based drift correction, and then translates the video frame by frame. Additionally, Fast4DReg can be used for alignment multi-channel 2D or 3D images which is particularly useful for instruments that suffer from a misalignment of channels.

has function
Description

Spine Analyzer allows to semi-automatically segment dendritic spines in 3D+t images and to measure their volumes and the intensities of the signal within in different channels over time.

Neurites with segmented dendritic spines
Description

DeXtrusion is a machine learning based python pipeline to detect cell extrusions in epithelial tissues movies. It can also detect cell divisions and SOPs, and can easily be trained to detect other dynamic events.

DeXtrusion takes as input a movie of an epithelium and outputs the spatio-temporal location of cell extrusion events or other event as cell divisions. The movie is discretized into small overlapping rolling windows which are individually classified for event detection by a trained neural network. Results are then put together in event probability map for the whole movie or as spatio-temporal points indicating each event.

DeXtrusion probability map
Description

While a quickly retrained cellpose network (only on xy slices, no need to train on xz or yz slices) is giving good results in 2D, the anisotropy of the SIM image prevents its usage in 3D. Here the workflow consists in applying 2D cellpose segmentation and then using the CellStich libraries to optimize the 3D labelling of objects from the 2D independant labels.

Here the provided notebook is fully compatible with Google Collab and can be run by uploading your own images to your gdrive. A model is provided to be replaced by your own (create by CellPose 2.0)

has function
example of usage
Description

CellStich proposes a set of tools for 3D segmentation from 2D segmentation: it reassembles 2D labels obtained from cell in slices in unique 3D labels across slices. It isparticularly robust to anisotropy, and is the ideal companion to cellpose 2D models or other 2D deep learning based models. One could also think about using it for cell tracking by overlap (using time as a third dimension).

cellstitch
Description

btrack is a Python library for multi object tracking, used to reconstruct trajectories in crowded fields. btrack implemented a residual U-Net model coupledd with a classification CNN to allow accurate instance segmentation of the cell nuclei. To track the cells over time and through cell divisions, btrack developed a Bayesian cell tracking methodology that uses input features from the images to enable the retrieval of multi-generational lineage information from a corpus of thousands of hours of live-cell imaging data.

need a thumbnail
Description

The method proposed in this paper is a robust combination of multi-task learning and unsupervised domain adaptation for segmenting amoeboid cells in microscopy. This end-to-end framework provides a consolidated mechanism to harness the potential of multi-task learning to isolate and segment clustered cells from low contrast brightfield images, and it simultaneously leverages deep domain adaptation to segment fluorescent cells without explicit pixel-level re- annotation of the data.

The entry-point to the codebase is the main.py file. The user has the option to

  • Train the network on their own dataset
  • Load a pre-trained model and use that for inference on their own data
  • NoteThe provided pretrained model was trained on 256x256 images. Results on different resolutions could require fine-tuning This model is trained (supervised) on brightfield, and domain adapted to fluorescence data. The results are saved as 'inference.png'
has function
daman
Description

MiNA is a simplified workflow for analyzing mitochondrial morphology using fluorescence images or 3D stacks in Fiji. The workflow makes use of ImageJ Ops3D ViewerSkeletonize (2D/3D)Analyze Skeleton, and Ridge Detection. In short, the tool estimates mitochondrial footprint (or volume) from a binarized copy of the image as well as the lengths of mitochondrial structures using a topological skeleton. The values are reported in a table and overlays (or a 3D rendering) are generated to assess the accuracy of the analysis.

example skeleton image (from https://imagej.net/plugins/mina#processing-pipeline-and-usage)
Description

The Incucyte® Base Analysis Software provides a guided interface and purpose-built tools, which include the process of acquiring, viewing, analyzing and sharing images of living cells.

need a thumbnail
Description

The authors present an ImageJ-based, semi-automated phagocytosis workflow to rapidly quantitate three distinct stages during the early engulfment of opsonized beads.

Description

Junction Mapper is a semi-automated software (Java Desktop application) for analysing data from images of cells in close proximity to each other in monolayers. The focus of Junction Mapper is to measure the morphology of cell boundaries, define single junctions and quantify the length, area and intensity of the staining of different proteins localised at cell-cell contacts. The output are various unique parameters that assess the contacting interface between cells and up to two junctional markers.

junction mapper
Description

BaSiC is a software tool for Background and Shading correction of Optical Microscopy Images. It implements an image correction method based on low-rank and sparse decomposition to solve both shading in space and background variation in time. It can correct temporal drift in time-lapse microscopy data and thus improve continuous single-cell quantification. BaSiC is available as a Fiji/ImageJ plugin.


has function
A BaSiC Tool for Background and Shading Correction of Optical Microscopy Images
Description

The tool allows to measure the area of the invading spheroïd in a 3D cell invasion assay. It can also count and measure the area of the nuclei within the spheroïd.

need a thumbnail
Description

webKnossos is an open-source data sharing and annotation platform for tera-scale 2D and 3D image datasets.

The core features of webKnossos are:

  • fast 3D data streaming
  • share links to specific locations in the data
  • uniquely fast skeleton annotation (flight mode) and
  • efficient volume annotation
  • mesh rendering
  • collaboration and sharing tools

webKnossos facilitates image analysis workflows on multi-terabyte datasets, including visualization of raw and multi-modal microscopy data, distributed training data generation and proof-reading of automatic segmentation.

As a scientific resource, webknossos.org serves as a database for published image datasets including their annotations.


Description

QuantiFish is a quantification program intended for measuring fluorescence in images of zebrafish, although use with images of other specimens is possible. This package is geared towards analysis of fluorescent infection models. The software is designed to automate processing of images of single fish, and outputs results as a .csv file. Alongside measures of total fluorescence above a threshold, this package also introduces several measures for dissemination and distribution of fluorescence throughout the specimen.

QuantiFish User Interface
Description

Histology Topography Cytometry Analysis Toolbox (histoCAT) is a package to visualize and analyse multiplexed image cytometry data interactively. It can also export data in.fcs data for further analysis using  a specialized cytometry sofwtare such as Flowjo. 

It can be run as a compiled standalone or from matlab.

Description

Analyze the clustering behavior of nuclei in 3D images. The centers of the nuclei are detected. The nuclei are filtered by the presence of a signal in a different channel. The clustering is done with the density based algorithm DBSCAN. The nearest neighbor distances between all nuclei and those outside and inside of the clusters are calculated.

has function
Description

ND-SAFIR is a software for denoising n-dimentionnal images especially dedicated to microscopy image sequence analysis. It is able to deal with 2D, 3D, 2D+time, 3D+time images have one or more color channel. It is adapted to Gaussian and Poisson-Gaussian noise which are usually encountered in photonic imaging. Several papers describe the detail of the method used in ndsafir to recover noise free images (see references).

It is available either in Metamorph (commercial version), either as command line tool. Source are available on demand.

has function
Description

BioImage.IO -- a collaborative effort to bring AI models to the bioimaging community. 

  • Integrated with Fiji, ilastik, ImJoy and more
  • Try model instantly with BioEngine
  • Contribute your models via Github

This is a database of pretrained deep Learning models. 

need a thumbnail
Description

LOBSTER (Little Objects Segmentation and Tracking Environment), an environment designed to help scientists design and customize image analysis workflows to accurately characterize biological objects from a broad range of fluorescence microscopy images, including large images, i.e. terabytes of data, exceeding workstation main memory.

  • 75 workflows available 
  • no programming, with GUI
  • matlab based 
Description

This is the ImageJ/Fiji plugin for StarDist, a cell/nuclei detection method for microscopy images with star-convex shape priors ( typically for Dapi like staining of nuclei). The plugin can be used to apply already trained models to new images.

Stardist
Description


DeepCell is neural network library for single cell analysis, written in Python and built using TensorFlow and Keras.

DeepCell aids in biological analysis by automatically segmenting and classifying cells in optical microscopy images. This framework consumes raw images and provides uniquely annotated files as an output.

The jupyter session in the read docs are broken, but the one from the GitHub are functional (see usage example )

deepcell
Description

Fiji plugin for detecting, tracking and quantifying filopodia

Description

This python toolbox performs registration between 2-D microscopy images from the same tissue section or serial sections in several ways to achieve imaging mass spectrometry (IMS) experimental goals.

This code supports the following works and enables others to perform the workflows outlined in the following works, please cite them if you use this toolbox:

  • Advanced Registration and Analysis of MALDI Imaging Mass Spectrometry Measurements through Autofluorescence Microscopy10.1021/acs.analchem.8b02884

  • Next Generation Histology-directed Imaging Mass Spectrometry Driven by Autofluorescence Microscopy10.1021/acs.analchem.8b02885

need a thumbnail
Description

Preprocessing step for high-density analysis methods in super resolution localisation microscopy: it aims at correcting artefacts due to these approaches with based on Haar Wavelet Kernel Analysis.

Description

Image correction software for chromatic shifts in fluorescence microscopy

null
Description

Daybook 2 is the analysis software linked to argoligth slides. It tests the performance of microscopes on various levels: illumination homogeneity, field distortion, lateral resolving power, stage drift, chromatic aberrations, intensity response... It works with various file formats but requires the use of an argolight test slide. 

Description

Assess the performance of the lasers, the objective lenses and other key components required for optimum confocal operation.

need a thumbnail
Description

This plugin allows measuring relevant parameters which helps testing, following and comparing microscopes performances. This is achieved by extracting four indicators out of standardized images, acquired from standardized samples: the estimation of the detector sensitivity, the evaluation of the field illumination homogeneity, the system resolution, and finally the characterization of its spectral registration.

has function
Description

Nessys: Nuclear Envelope Segmentation System


Nessys is a software written in Java for the automated identification of cell nuclei in biological images (3D + time). It is designed to perform well in complex samples, i.e when cells are particularly crowded and heterogeneous such as in embryos or in 3D cell cultures. Nessys is also fast and will work on large images which do not fit in memory.


Nessys also offers an interactive user interface for the curation and validation of segmentation results. Think of this as a 3D painter / editor. This editor can also be used to generate manually segmented images to use as ground truth for testing the accuracy of the automated segmentation method.


Finally Nessys, contains a utility for assessing the accuracy of the automated segmentation method. It works by comparing the result of the automated method to a manually generated ground truth. This utility will provide two types of output: a table with a number of metrics about the accuracy and an image representing a map of the mismatch between the result of the automated method and the ground truth.

has function
Description

This plugin detects a minimum cost z-surface in a 3D volume. A z surface is a topographic map indicating the altitude z as a function of the position (x,y) in the image. The cost of the surface depends on pixel intensity the surface is going through. This plugin find the z-surface with the lowest intensity in an image.

has function
Description

The interactive Watershed Fiji plugin provides an interactive way to explore local maxima and threshold values while a resulting label map is updated on the fly.

After the user has found a reliable parameter configuration, it is possible to apply the same parameters to other images in a headless mode, for example via ImageJ macro scripting.

Description

FoCuS-point is stand-alone software for TCSPC correlation and analysis. FoCuS-point utilizes advanced time-correlated single-photon counting (TCSPC) correlation algorithms along with time-gated filtering and innovative data visualization. The software has been designed to be highly user-friendly and is tailored to handle batches of data with tools designed to process files in bulk. FoCuS-point also includes advanced diffusion curve fitting algorithms which allow the parameters of the correlation functions and thus the kinetics of diffusion to be established quickly and efficiently.

Description

FoCuS-scan is software for processing and analysis of large-scale scanning fluorescence correlation spectroscopy (FCS) data. FoCuS-scan can correlate data acquired on conventional turn-key confocal systems and in the form of xt image carpets.

Description

Acquiarium is open source software (GPL) for carrying out the common pipeline of many spatial cell studies using fluorescence microscopy. It addresses image capture, raw image correction, image segmentation, quantification of segmented objects and their spatial arrangement, volume rendering, and statistical evaluation.

It is focused on quantification of spatial properties of many objects and their mutual spatial relations in a collection of many 3D images. It can be used for analysis of a collection of 2D images or time lapse series of 2D or 3D images as well. It has a modular design and is extensible via plug-ins. It is a stand-alone, easy to install application written in C++ language. The GUI is written using cross-platform wxWidgets library.

Acquiarium functionalities diagram
Description

ZEN and APEER – Open Ecosystem for integrated Machine-Learning Workflows

Open ecosystem for integrated machine-learning workflows to train and use machine-learning models for image processing and image analysis inside the ZEN software or on the APEER cloud-based platform

Highlights ZEN

  • Simple User Interface for Labeling and Training
  • Engineered Features Sets and Deep Feature Extraction + Random Forrest for Semantic Segmentation
  • Object Classification workflows
  • Probability Thresholds and Conditional Random Fields
  • Import your own trained models as *.czann files (see: czmodel · PyPI)
  • Import "AIModel Containes" from arivis AI for advanced Instance Segmentation
  • Integration into ZEN Measurement Framework
  • Support for Multi-dimensional Datasets and Tile Images
  • open and standardized format to store trained models
ZEN Intellesis Segmentation

ZEN Intellesis Segmentation - Training UI

ZEN Intellesis - Pretrained Networks

ZEN Intellesis Segmentation - Use Deep Neural Networks

Intellesis Object Classification

ZEN Object Classification

Highlights Aarivis AI

  • Web-based tool to label datasets to train Deep Neural Networks
  • Fully automated hyper-parameter tuning
  • Export of trained models for semantic segmentation and AIModelContainer for Instance Segmentation
Annotation Tool

APEER Annotation Tool

Description

This notebook uses the rOMERO-gateway and EBImage to process an Image associated to the paper 'Timing of gene expression in a cell-fate decision system'.

The Image "Pos22" is taken from the dataset idr0040-aymoz-singlecell/experimentA/YDA306_AGA1y_PRM1r_Mating. It is a timelapse Image with 42 timepoints separated by 5 minutes. This Image is used to fit a model for the growth of the yeast cells. The notebook does not replicate any of the analysis of the above mentioned paper.

Its purpose is mainly to demonstrate the use of Jupyter, rOMERO-gateway and EBimage.


What it does:

  • For each time point of one movie:
    • Read the image for this time point  from the IDR
    • Threshold the images and count the cells using EBimage functions
  • Fit an exponential model to the count of cells against time to get a coefficient of grow (exponential factor)


has function
Description

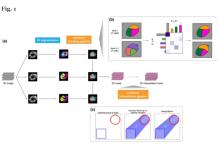
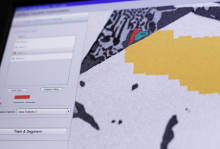
This one example workflow from the Cell Profiler(CP)  Examples . CP is commonly used to count cells or other objects as well as percent-positives, by measuring the per-cell staining intensity. This pipeline shows how to do both of these tasks, and demonstrates how various modules may be used to accomplish the same result. 

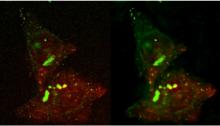
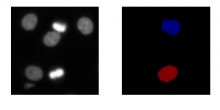
In a few words, it used the IdentifyPrimaryObject module of CellProfiler to detect nuclei from a channel (e.g DAPI), then again the same module on another channel to detect another probe (e.g some particular histone)  .

Then objects (nuclei) are related to the second object (Histone), to create a parent child-relation ship: where nuclei can have histone has child. Nuclei are then filtered according to the property of having histone (positive) or not having histone (negtiveobject) related to them.  If needed, nuclei can be expanded in order to include touching object rather than object inside only.

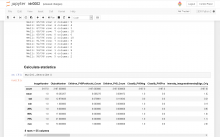
The percentage of positive nuclei vs total number of nuclei can then be computed using the CalculateMath Module.

Positivepercentcell
Description

This is a Jupyter notebook demonstrating the run of a code from IDR data sets by loading a CellProfiler Pipeline 

The example here is applied on real data set, but does not correspond to a biological question. It aims to demonstrate how to create a jupyter notebook to process online plates hosted in the IDR.

It reads the plate images from the IDR.

It loads the CellProfiler Pipeline and replace the reading modules used to read local files from this defaults pipeline by module allowing to read data remotely accessible.

It creates a CSV file and displays it in the notebook.

It makes some plot with Matplotlib.


jupyter
Description

This workflow can be ran with data from 3D-SIM showing the centrosomes in order to compare the distribution of diameters of rings (or toroids) of different proteins from the centrioles or the peri centriolar material. It aims to reproduce the results of the Nature Cell Biology Paper Subdiffraction imaging of centrosomes reveals higher-order organizational features of pericentriolar material  from the same data set but with a different analysis method.

It is slightly different from the methods described in the paper itself, where the method was to work on a maximum intensity projection of a 3D-SIM stack, and then to fit circle to the centrioles to estimate the diameters of the toroids.

In this workflow, the images are read from the IDR , then process by thresholding (Maximum entropy auto thresholding with Image J), and processed by Analyze Particles  with different measurement sets, including the bouding box. Then the analysis of diameters and the statistical test are performed using R. All the code and data sets are available, and in the case of this paper have shown a layered organisation of the proteins.

Combined view from Figure 1 Lawo et al.
Description

Python/C++ port of the ImageJ extension TurboReg/StackReg written by Philippe Thevenaz/EPFL.

A python extension for the automatic alignment of a source image or a stack (movie) to a target image/reference frame.

need a thumbnail
Description

Quantitative Criterion Acquisition Network (QCA Net) performs instance segmentation of 3D fluorescence microscopic images. QCA Net consists of Nuclear Segmentation Network (NSN) that learned nuclear segmentation task and Nuclear Detection Network (NDN) that learned nuclear identification task. QCA Net performs instance segmentation of the time-series 3D fluorescence microscopic images at each time point, and the quantitative criteria for mouse development are extracted from the acquired time-series segmentation image. The detailed information on this program is described in our manuscript posted on bioRxiv.

has function
Description

The purpose of the workflow is ....

First you need

need a thumbnail
Description

  FlyLimbTracker is  a method that uses active contours to semi-automatically track body and leg segments from video image sequences of unmarked, freely behaving Drosophila flies. This approach can be used to measure leg segment motions during a variety of locomotor and grooming behaviors.

For now the plugin have to be downlaoded directly from the EPFL website (see link), not from the search bar as usual in ICY.


Drosophila track legs
Description

Classification of trajectoire: need tracking results as input and will then classify the trajectories as  brownian motion, confined brownian or directed.

has function
thot
Description

SliceMap

Whole brain tissue slices are commonly used in neurobiological research for analyzing pathological features in an anatomically defined manner. However, since many pathologies are expressed in specific regions of the brain, it is necessary to have an annotation of the regions in the brain slices. Such an annotation can be done by manual delineation, as done most often, or by an automated region annotation tool.

SliceMap is a FIJI/ImageJ plugin for automated brain region annotation of fluorescent brain slices. The plugin uses a reference library of pre-annotated brain slices (the brain region templates) to annotate brain regions of unknown samples. To perform the region annotation, SliceMap registers the reference slices to the sample slice (using elastic registration plugin BUnwarpJ) and uses the resulting image transformations to morph the template regions towards the anatomical brain regions of the sample. The resulting brain regions are saved as FIJI/ImageJ ROI’s (Regions Of Interest) as a single zip-file for each sample slice.

More information can also be found in "SliceMap: an algorithm for automated brain region annotation", Michaël Barbier, Astrid Bottelbergs, Rony Nuydens, Andreas Ebneth, Winnok H De Vos, Bioinformatics, btx658, https://doi.org/10.1093/bioinformatics/btx658

Example: SliceMaps brain region segmentation