
Contents
| Image | Title | Category | Type | Description | Updated |
|---|---|---|---|---|---|
| |
2D tracking using KNIME and Fiji | Software | Workflow | This simple KNIME workflow solution tracks 2D objects/cells in time series. After a few intensity based preprocessing steps, objects/cells are segmented first, then it uses Fiji TrackMate LAP method for the tracking task. Documentation starts from p23 of the linked PDF. Example Image: mitocheck_small.tif (2.9M) |
05/14/2018 - 23:16 |

|
ImmunoMembrane | Software | Component | 06/07/2018 - 02:21 | |
|
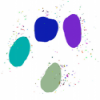
2D spots counting using KNIME | Software | Workflow | These two KNIME workflow solutions are similar: first one detects nuclei and spots inside the nuclei without taking care of surrounding regions, i.e. mitochondria. The second one provides the full solution including spots in mitochondria. see section 2.4 for KNIME workflow. Section 2.3 is also available, using Fiji. |
05/14/2018 - 23:26 |
|
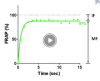
Performing a Fluorescence Recovery after Photobleaching (FRAP) experiment | Software | Workflow | The article describes how a FRAP experiment can be conducted and subsequently analyzed. This includes steps in ImageJ and subsequent normalization of the intensity data. This is a qualitative analysis, and curve fitting is done using Excel. |
05/07/2018 - 18:46 |
| |
ICY batch pixel density measurement | Software | Component | For each ROI, provides the ratio of pixels over a given threshold over the total number of pixels in the ROI. |
04/29/2023 - 21:58 |

|
easyFRAP | Software | Collection | Very simple application that lets you load your time-lapse intensity data to generate the normalized FRAP recovery curve and perform exponential curve fitting. |
04/29/2023 - 14:02 |

|
ICY Median filter via ImageJ | Software | Component | This protocol perform a median filter on the active sequence using the ImageJ rank filter plugin. Then, it converts the result back into Icy for display. An example showing passing data between ICY and ImageJ using ImagePlus object. |
04/29/2023 - 22:21 |

|
Magic Montage | Software | Component | This tool adds to ImageJ functions to build and organize montages. It comes with the ImageJ installer but can also be downloaded from the ImageJ wiki. A video tutorial is available. |
08/17/2018 - 15:00 |
|
|
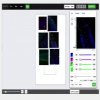
Organise Image Data using OMERO | Software | Workflow | OMERO is an image database application consisting of a server and several clients, the most important of which are the web client and _Insight_ java application. Metadata are extracted from images that have been imported (either using the Insight client, or directly from the filesystem), and this is accessible for search. A standardised hierarchy of _Project > Dataset > Image_ in which image thumbnails can be viewed, combined with group membership, tagging, and attachment of results and other files gives a powerful framework for organising scientific image data. |
08/16/2018 - 17:42 |

|
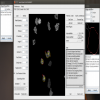
Cell segmentation and quantification with CellX | Software | Workflow | CellX is an open-source software package of workflow template for cell segmentation, intensity quantification, and cell tracking on a variety of microscopy images with distinguishable cell boundary. Installation and step-by-step usage details are described in Mayer et al (2013). |
04/27/2023 - 17:43 |

|
Find, Draw and Measure Wells in a Multi-Well Plate Picture | Software | Component | 06/05/2018 - 02:48 | |
|
OMERO.figure | Software | Collection | 05/27/2018 - 16:40 | |

|
Manual Tracking Components of ImageJ | Software | Workflow | The Fiji distribution of ImageJ comes with several manual tracking tools, two of which are particularly useful: * _Plugins->Tracking->Manual Tracking_ * _Plugins->Tracking->Manual tracking with TrackMate_ (TrackMate is an advanced automatic tracking tool, with the option for manual editing of tracks) The _Manual Tracking_ plugin is quick to use, intuitive and produces easy-to-understand output. TrackMate has the advantage that automatic detection and linkage can be combined with manual input. Update sites |
05/24/2023 - 19:09 |
| |
scikit-image | Software | Collection | Image processing library for Python >The scikit-image SciKit (toolkit for SciPy) extends scipy.ndimage to provide a versatile set of image processing routines. It is written in the Python language. This SciKit is developed by the SciPy community. All contributions are most welcome! |
12/17/2018 - 02:00 |
|
|
Separate image channel in folder | Software | Component | This protocol takes a folder containing images as input and extract each channel in a separate sub folder. |
03/02/2020 - 14:51 |
|
|
quickPALM | Software | Workflow | QuickPALM is a set of programs to aid in the acquisition and image analysis of data in photoactivated localization microscopy (PALM) and stochastic optical reconstruction microscopy (STORM). QuickPALM features the associated QuickPALM ImageJ plugin, which enables PALM/STORM 2D/3D/4D particle detection and image reconstruction in ImageJ. | 09/12/2017 - 20:03 |
|
|
Moment thresholding (ImageJ) | Software | Component | This method allows to compute a threshold that preserves the moments of an image. In ImageJ/Fiji, you can access it in Image->Ajust->Threshold and choose Moments in the list. In Aphelion, the tool is in Segmentation->Threshold->AphImgMomentThreshold The original paper is 2449 |
03/02/2020 - 21:47 |
|
2D cell tracking and analysis of morphological dynamics | Software | Workflow | 02/05/2019 - 10:55 | |
|
|
Image anonymisation | Software | Workflow | This macro copies all images from one folder to another, randomizing names but keeping channels from the same image grouped. This is useful for blind quantification of images. | 09/12/2017 - 20:03 |
|
|
Track cell intensity | Software | Workflow | Tracks a cell in a 2D video using active contours, and produces a list of ROI where intensity is measured and reported into a workbook. The cell must be first delineated with a ROI in the first image of the video. |
05/15/2018 - 01:25 |