Description
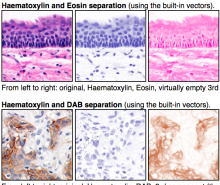
[no download link, this description itself explains the steps to quantify staining in tissue sections] The Color Deconvolution plugin for ImageJ can be used to digitally separate up to three stains from brightfield images, after which standard ImageJ commands can be used. The algorithm is described in Ruifork and Johnston (2001). **However**, it is **very** important to take into consideration the caveats on the linked URL. In particular, note that: - Stain colors depend on numerous factors, such as the precise stains and scanner; therefore, the 'default' stain vectors (used to define the colors) are unlikely to be optimal and may be very inaccurate. See the URL instructions for how to create new stain vectors. - Pixel values should be interpreted with extreme caution; in particular, note the warning regarding 'brown' staining that *attempting to quantify DAB intensity using this plugin is not a good idea*. Note, the pixel values provided by this plugin are 8-bit and **not** equivalent to 'optical densities' frequently presented in the literature. Color deconvolution is particularly helpful in separating stains so that stained regions can be detected (e.g. by setting a threshold), and then the number or areas of stained structures may be quantified. Two potential approaches would be: 1. If one measurement should be made for the entire image: - *Image > Adjust > Threshold...* - *Edit > Selection > Create Selection* - *Analyze > Measure* 2. If distinct structures should be measured: - *Image > Adjust > Threshold...* - *Analyze > Analyze Particles...*