3D

Description

The research goal of this paper was to provide unbiased counts of labeled astrocytes and to estimate the area they cover, further to develop tools for defining the orientation of coupling within astrocyte networks under different stimuli.

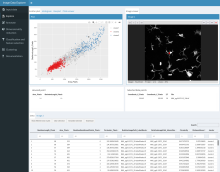
In order to count the astrocytes and estimate the area they cover the following steps were used in this software.

Pre-processing: z-project (using max intensity); split channels; subtract background; remove outliers.

Segmentation: adjust threshold and convert to a binary file; Watershed.

Cell counting: Analyze particles

Measure Astrocytic network area: select a ROI using the polygon tool; set measurements (area); ROI manager -> add the traced polygon; measure.

need a thumbnail
Description

FPBioimage is a volumetric visualization tool which runs in all modern web browsers. Try the tool yourself at our example site here.

has function
Description

The Image Data Explorer is a Shiny app that allows the interactive visualization of images and ROIs associated with data points shown in a scatter plot. It is useful for exploring the relationships between images/ROIs and associated data represented in tabular format. Additional functionalities include data annotation, dimensionality reduction and classification and feature selection.

has function
Description

A command line tool that allows to quantitatively compare two volumes of binary segmentations. Implements 22 different metrics for comparing segmentations such as Dice Coefficient, Hausdorff Distance and average Distance.