Bioimage informatics

Synonyms
Bioimage analysis
Description

Quote: *A GUI-based program which manually detects spots and places them into previously detected meshes. Currently the program runs from MATLAB only. *

need a thumbnail
Description

Quote: *SpotFinderZ (from now on simply SpotFinder) detects round, usually diffraction-limited spots inside bacterial cells outlined with MicrobeTracker and places them into the meshes structure produced by MicrobeTracker. The program is written in MATLAB and saves the data in the MicrobeTracker format by appending additional fields.*

has function
need a thumbnail
Description

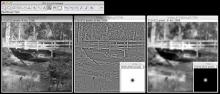
The Fourier transform of an image produces a representation in frequency space: i.e. separated according to spatial frequency (effectively scale). The 2D amplitude map of the different spatial frequencies is symmetrical, and is commonly displayed with low spatial frequencies (large features) in the centre, highest spatial frequencies (small features) at the edges. Fourier filtering involves suppressing or enhancing features in the Fourier domain before carrying out an inverse Fourier transform to obtain a filtered real-space image. ImageJ's _Process > FFT > Bandpass Filter_ implements two common Fourier-filtering functions: 1. filtering for specific sizes of feature in an image by selecting minimum and maximum feature sizes (selecting a radial band of frequencies in Fourier space); 2. filtering out repetitive horizontal or vertical stripes by cutting out a zero-frequency stripe in the orthogonal direction in frequency space. The example image above shows the effect of filtering for 2 feature size ranges: 0-8 pixels, and 8-256 pixels; where the former appears "flattened" or washed-out, and the latter very blurred. The small images displayed to the lower-right of each filtered image correspond to the mask applied to the Fourier transform. Such filtering can be useful prior to global thresholding, for noise suppression, etc.

ImageJ bandpass screenshot
Description

Implementation of some image correlation spectroscopy tools

need a thumbnail
Description

The workflow consists of firstly identifying spot (which can be also gravity center of cells identified by another method), and then secondly compute trajectories by linking these spots by global optimisation with a cost function. This method is part of the methods evaluated in Chanouard et al (2014) as "method 9" and is described in detail in its supplementary PDF (page 65).

Dependencies

Following plugins are required.

  1. JAR to be placed under IJ plugin directory
  2. A pdf file with instructions and output description is also available in the zip .
  3. MTrackJ : Used for visualization of tracks. Preinstalled in Fiji.
  4. Imagescience.jar: This library is used by MTrackJ. Use update site to install this plugin.
  5. jama.jar. Preinstalled in Fiji.

##Advantages:

  • support blinking (with a parameters allowing it or not)
  • fast,
  • can be used in batch, some analysis results provided.
  • No dynamic model.
  • The tracking part is not dependent of ImageJ.

Pitfalls:

  • does not support division
  • the optimization algorithm used is a simulated annealing, so results can be slightly different between two runs.
  • No Dynamic model (so less good results but can be used for a first study of the kind of movements)

##The sample data

The parameters used for this example data Beads, were

  1. detection: 150
  2. the max distance in pixels: 20
  3. max allowed disappearance in frame: 1