Commercial

Description

HistoMetrix is an advanced histology analysis software designed to simplify image processing and analysis for biologists and pathologists. Powered by the most advanced deep learning technology, HistoMetrix enables you to effortlessly uncover valuable insights and visualize results without the need for extensive technical expertise. Let’s explore the key features that make HistoMetrix the ultimate solution for histology analysis.

HistoMetrix leverages cutting-edge deep learning technology to streamline and simplify image processing for histology analysis. You can easily navigate through complex datasets, detect and analyze tissue structures, and extract meaningful information with just a few clicks. Research use only.


HistoMetrix combines advanced deep learning technology with cost-effectiveness, making it the ideal histology analysis software for biologists and pathologists. With HistoMetrix, effortlessly uncover valuable insights, visualize results, and simplify image processing, all while enjoying significant cost savings compared to other solutions. Benefit from affordable pricing plans, no expensive hardware requirements, and no need for costly training programs. HistoMetrix streamlines workflows, automates tasks, and provides efficient analysis tools, allowing you to save valuable time and resources. Experience the cost-effective solution for histology analysis and accelerate your research with HistoMetrix.

HistoMetriX for image analysis of histology slides
Description

The Incucyte® Base Analysis Software provides a guided interface and purpose-built tools, which include the process of acquiring, viewing, analyzing and sharing images of living cells.

need a thumbnail
Description


Relate is a correlative software package optimised to work with EM, EDS, EBSD, & AFM data and images.  It provides the tools you need to correlate data from different microscopes, visualise multi-layered data in 2D and 3D, and conduct correlative analyses.

  • Combining data from different imaging modalities (e.g. AFM, EDS & EBSD)

  • Interactive display of multi-layer correlated data

  • Analytical tools for metadata interrogation

  • Documented workflows and processes

Correlate

  • Import data from AZtec using the H5oina file format
  • Import AFM data
  • Correlate both sets of data using intuitive image overlays and image matching tools
  • Produce combined multimodal datasets

Visualise

  • 2D display of multi-layered data
  • 3D visualisation of topography combined with AFM material properties, EM images, and EDS & EBSD map overlays
  • Customisation of colour palettes, data overlays, image rendering options, and document display
  • Export images and animations

Analyse

  • Generate profile (cross section) views of multimodal data
  • Measure and quantify data across multiple layers
  • Analyse areas via data thresholding using amount of x-ray counts, phase maps, height, or other material properties.
  • Select an extensive range of measurement parameters
  • Export analytical data to text or CSV files
Relate analysis workflow example
Description

Voxelytic-Align is a commercial software provided as a service on cloud targetted to electron microscopy reconstruction (alignement, artifact correction...)

Description

Machine Learning made easy

APEER ML provides an easy way to train your own machine learning
models and segment your microscopy images. No expertise or coding required.

APEER

Description

ND-SAFIR is a software for denoising n-dimentionnal images especially dedicated to microscopy image sequence analysis. It is able to deal with 2D, 3D, 2D+time, 3D+time images have one or more color channel. It is adapted to Gaussian and Poisson-Gaussian noise which are usually encountered in photonic imaging. Several papers describe the detail of the method used in ndsafir to recover noise free images (see references).

It is available either in Metamorph (commercial version), either as command line tool. Source are available on demand.

has function
Description

Collection of add-ons (recipes, scripts, demos,…) that will help you improve your day-to-day use of Amira-Avizo and PerGeos Software and make you gain both time and efficiency.
Use the Search field to look for specific keywords related to your domain of interest. The different filters also help you target specific resources.

Amira logo
Description

Epina ImageLab is a Microsoft Windows-based multisensor imaging tool for processing and analyzing hyperspectral images. It is a modular system consisting of a basic engine, a graphical user interface, a chemometrics toolbox and optional user-supplied modules. It supports the most important spectroscopic imaging techniques, such as UV/Vis, infrared, Raman, THz, optical emission/absorption, and mass spectrometry. On top of that Epina ImageLab enables the user to merge hyperspectral images with maps of physical properties and conventional high-resolution color photos. 

need a thumbnail
Description

Wavelet Toolbox™ provides apps and functions for the time-frequency analysis of signals and multiscale analysis of images.

need a thumbnail
Description

Align two images using intensity correlation, feature matching, or control point mapping

Together, Image Processing Toolbox™ and Computer Vision Toolbox™ offer four image registration solutions: interactive registration with a Registration Estimator app, intensity-based automatic image registration, control point registration, and automated feature matching. 

has topic
need a thumbnail
Description

Wolfram Mathematica (usually termed Mathematica) is a modern technical computing system spanning most areas of technical computing — including neural networksmachine learningimage processinggeometrydata sciencevisualizations, and others. The system is used in many technical, scientific, engineering, mathematical, and computing fields.

Description

Dragonfly is a software platform for the intuitive inspection of multi-scale multi-modality image data. Its user-friendly experience translates into powerful quantitative findings with high-impact visuals, driven by nuanced easy-to-learn controls.

For segmentation: It provides an engine fior machine Learning, Watershed and superpixel methods, support histological data .

It offers a 3D viewer, and python scripting capacities .

It is free for reserach use, but not for commercial usage.

DragonFly
Description

online image data management system which supports authenticated image upload, cloud-based storage, project-based management and viewing of standard and whole slide images. One can use different annotation tools to highlight important objects or areas within images. It is the first basic version and new features such as sharing for easy collaboration with your colleagues or first automated analysis applications based on artificial intelligence will be added soon.

Ikosa Portal: multi user image data management

Ikosa Prisma: Automated Image Analysis based on deep learning (available in summer 2019)

Free if limited to 2 users and 1 gigabyte, otherwise montly fees.


ikosa
Description

Multimodal image registration based on manual selection of matching pairs of landmarks. This image registration workflow is based
on MATLAB’s image processing toolbox using the identification of sites of clathrin-mediated endocytosis by correlative light electron microscopy (CLEM) as an example.

need a thumbnail
Description

Tracking tools, such as TrackMate, produce tracks and their role stops there. However, tracks are just an intermediate data structure in the workflow. Their subsequent analysis produces the numbers upon which scientific conclusions are made. The track analysis is most often specific to the scientific question to be addressed, and therefore tracking tools remain generic and seldom include specialized analysis modules. Another toolset is required for track analysis; this workflow focuses on using MATLAB.

need a thumbnail
Description

This workflow presents single-particle tracking in Fiji using Track-Mate, and track motility analysis in MATLAB using @msdanalyzer. 

need a thumbnail
Description

Daybook 2 is the analysis software linked to argoligth slides. It tests the performance of microscopes on various levels: illumination homogeneity, field distortion, lateral resolving power, stage drift, chromatic aberrations, intensity response... It works with various file formats but requires the use of an argolight test slide. 

Description

AssayScope is an intuitive application dedicated to large scale image processing and data analysis. It is meant for histology, cell culture (2D, 3D, 2D+t) and phenotypic analysis. 

need a thumbnail
Description

IDE for JVM

Every aspect of IntelliJ IDEA is specifically designed to maximize developer productivity. Together, the powerful static code analysis and ergonomic design make development not only productive but also an enjoyable experience.

It can be seen as an alternative to Eclipse for example for java based development. It exists in both a commercial and a free and open source version.

Description

ZEN and APEER – Open Ecosystem for integrated Machine-Learning Workflows

Open ecosystem for integrated machine-learning workflows to train and use machine-learning models for image processing and image analysis inside the ZEN software or on the APEER cloud-based platform

Highlights ZEN

  • Simple User Interface for Labeling and Training
  • Engineered Features Sets and Deep Feature Extraction + Random Forrest for Semantic Segmentation
  • Object Classification workflows
  • Probability Thresholds and Conditional Random Fields
  • Import your own trained models as *.czann files (see: czmodel · PyPI)
  • Import "AIModel Containes" from arivis AI for advanced Instance Segmentation
  • Integration into ZEN Measurement Framework
  • Support for Multi-dimensional Datasets and Tile Images
  • open and standardized format to store trained models
ZEN Intellesis Segmentation

ZEN Intellesis Segmentation - Training UI

ZEN Intellesis - Pretrained Networks

ZEN Intellesis Segmentation - Use Deep Neural Networks

Intellesis Object Classification

ZEN Object Classification

Highlights Aarivis AI

  • Web-based tool to label datasets to train Deep Neural Networks
  • Fully automated hyper-parameter tuning
  • Export of trained models for semantic segmentation and AIModelContainer for Instance Segmentation
Annotation Tool

APEER Annotation Tool

Description

This Matlab code simulates the noise of the confocal laser scanning microscope depending on the depth in the image stack (serial sections). Using the stack of binary images, it applies different levels of noise in the signal and background parts of the images to simulate confocal images. This is useful for generating "virtual ground truth" images with known values of sample rotation and distortion. 

Description

TeraStitcher is a free tool that enables the stitching of Teravoxel-sized tiled microscopy images even on workstations with relatively limited resources of memory (<8 GB) and processing power. It exploits the knowledge of approximate tile positions and uses ad-hoc strategies and algorithms designed for such very large datasets. The produced images can be saved into a multiresolution representation to be efficiently visualized (e.g. Vaa3D-TeraFly) and processed.

Description

Software for analysis, visualization, simulation, and acquisition  of data from spectroscopy and fluorescence microscopy.

  • Fluorescence Correlation Spectroscopy (FCS)
  • Fluorescence Lifetime Imaging (FLIM) and Phasor plots
  • Förster Resonance Energy Transfer (FRET)
  • Generalized Polarization (GP) and Spectral Phasors
  • Number and Brightness (N&B)
  • Photon Counting Histogram (PCH)
  • Raster and Spatio-temporal Image Correlation Spectroscopy (RICS and STICS)
  • Single Particle and Modulation Tracking (SPT, MT)
  • Image Mean Square Displacement (iMSD)
  • Pair correlation function (pCF)
has function
Description

The invention comprises a software tool, NeuronMetrics, which functions as a set of modules that run in the open-source program ImageJ. NeuronMetrics features a novel method for estimating neural “branch number” (a measure of the axonal complexity) from two-dimensional images. In addition, the tool features a novel method for modeling neural structure in large “gaps” that result from image artifacts.


has topic
need a thumbnail
Description

QuantCenter is the framework for 3DHISTECH image analysis applications. with the goal of helping the pathologists to diagnose in an easier way. QuantCenter, is optimized for whole slide quantification. It has a linkable algorithm concept that tries to provide an easy-to-use and logical workflow. The user has different quantification modules that he or she could link one after other to fine-tune or to speed up the analysis.

QuantCenter logo
Description

Neurolucida is a powerful tool for creating and analyzing realistic, meaningful, and quantifiable neuron reconstructions from microscope images. Perform detailed morphometric analysis of neurons, such as quantifying 1) the number of dendrites, axons, nodes, synapses, and spines, 2) the length, width, and volume of dendrites and axons, 3) the area and volume of the soma, and 4) the complexity and extension of neurons. See 10.3389/fnins.2012.00049

Neurolucida example
Description

TurtleSeg is an interactive 3D image segmentation tool. TurtleSeg has an automated system, Spotlight, for automatically directing the user towards the next steps. Typically, a user loads a 3D image and then manually contour a sparse number of slices, the full 3D segmentation can then be built automatically.

need a thumbnail
Description

WaveTracer is a plugin for Metamorph. It represents a functional method for real-time reconstruction with automatic feedback control, without compromising the localization accuracy. It relies on a wavelet segmentation algorithm, together with a mix of CPU/GPU implementation.

has function
need a thumbnail
Description

arivis Vision4D is a modular software for working with multi-channel 2D, 3D and 4D images of almost unlimited size independent of available RAM. Many imaging systems, such as high speed confocal, Light Sheet/ SPIM and 2 Photon systems, can produce a huge amount of multi-channel data, which arivis Vision4D handles without constraints. Terabyte ready arivis Vision4D main functionality: Easy import of most image formats from microsopes as well as biological formats High performance interactive 3D / 4D rendering on standard PCs and laptops with 3D Graphics Support Intuitive tools for stitching and alignment to create large multi-dimensional image stacks Immediate 2D, 3D and 4D visualization, annotation and analysis regardless of image size Creation, import, and export of 4D Iso-surfaces Powerful Analysis Pipeline for 3D /4D image analysis (cell segmentation, tracking, annotation, quantitative measurement and statistics, etc) Semi-automatic/manual segmentation and tracking with interactive Track Editor Easy design and export of 3D / 4D High Resolution Movies Seamless integration of custom workflows via Matlab API and Python scripting Data sharing for collaboration A user friendly software, easy to learn and use for any life scientist

need a thumbnail
Description
A commercial software traditionally used in Industry and Engineering/Science to enable fast software development and deployment of a very broad range of devices control. Labview enables graphically oriented programming (no text-based coding) and offers many ready-made tools to perform basic tasks on complex data (including image data), maths operation, data handling and representation. For Image processing and analysis, Labview offers the integrated "NI Vision" tool, used in image-based quality control of production lines with a broad selection of Image-based filters/operations. In microscopy, Labview can be used efficiently to perform any kind of instrument control, and in particular "Feedback Microscopy" (also called intelligent microscopy, etc...) where the live analysis of a captured image will update the target of the microscope to make it understand where to image efficiently.
need a thumbnail
Description

The software is designed for pathologists. Image analysis protocols are built from graphical user interfaces; there is no need for programming experience or an extensive training program. Cloud and deployed solutions are available. Visiopharm can be employed to develop workflows (apps) for the user. Modular structure with multiple packages: VisiomorphDP™ TissuemorphDP™ Arrayimager™ Tissuealign™ Visiomorph™ Tissuemorph™ Microimager™ Fluoimager™

Visiopharm screenshot
Description
MountainsMap is a surface imaging and metrology software published by the company Digital Surf. Its main application is micro-topography, the science of studying surface texture and form in 3D at the microscopic scale. The software is used mainly with stylus-based or optical profilometers, optical microscopes and scanning probe microscopes. MountainsMap is mainly offered as embedded or optional OEM analysis software by most profilometer and microscope manufacturers, usually under their respective brands; it is sold for instance as: MountainsMap - X on Nikon's microscopes Leica Map on Leica's microscopes ConfoMap on Carl Zeiss' microscopes
need a thumbnail
Description

The original paper describes a method to analyze mitochondrial morphology in 2D and 3D.

Description

In the commercial image analysis software "Volocity", automated measurement protocols can be constructed by dragging, dropping and configuring a sequence of individual "tasks".

By combining the "Find Objects" task with a subsequent "Track" task, 3D objects can be identified and followed over time. The initial "Find Objects" segmentation can be refined, e.g. using "Separate Touching Objects"; and tracking results in the form of "Measurement Items" can be viewed in tabular form, as a graph, etc.

Description

A commercial image analysis software. It's interface allows to easily perform measurements and image analysis. Your actions can be recorded and a macro (in a basic script language) can then be created. Almost no knowledge in programming is needed. You can also use python. A SDK is also available to develop stand alone applications in c++. Additional modules allow to use specific operations (3D operators... Examples of available categories of operators : filtering, edge detection, mathematical morphology, segmentation, Frequency operations, mathematical/logical operations, measurements...

need a thumbnail
Description
softWoRx® 5.0 is the latest in DeltaVision image acquisition software. Find samples, acquire images and process data quickly and efficiently with the intuitive user interface. softWoRx 5.0 includes visualization and measurement tools and exports data in a wide variety of formats making it a versatile tool for more than just image acquisition.
need a thumbnail
Description
Image-Pro software includes the latest tools for scientific and industrial image analysis and image processing. Capture, process, measure, share, visualize and compare. ImagePro Insight ImagePro Priemier
need a thumbnail
Description

Metamorph provides all tools needed to perform analysis of acquired images with user-friendly application modules for biology-specific analysis such as cell signaling, cell counting, and protein expression.

Matamorph user interface
Description

The Huygens Software Suite consists of different image processing packages with functionalities that include deconvolution, interactive analysis, and volume visualization of 2D-3D multi-channel and time series images from fluorescence microscopes such as widefield, confocal, multi-photon, spinning disk, Array Detector, STED, and Light Sheet

Description
Wherever three-dimensional data sets need to be processed, in materials science, geosciences, environmental or engineering applications, Avizo offers abundant state-of-the-art features within an intuitive workflow and easy-to-use graphical user interface. Avizo is packaged in different Editions, with optional eXtension modules. Each Avizo Edition delivers tailored user interface and specific feature-set for each application area: [Avizo Standard](http://www.vsg3d.com/avizo/standard) [Avizo Earth](http://www.vsg3d.com/avizo/earth) [Avizo Wind](http://www.vsg3d.com/avizo/wind) [Avizo Green](http://www.vsg3d.com/avizo/green) [Avizo Fire](http://www.vsg3d.com/avizo/fire)
need a thumbnail
Description

Amira is 3D visualization and analysis software for life sciences.
 

" Amira software is a powerful, multifaceted 3D platform for visualizing, manipulating, and understanding life sciences data from computed tomography, microscopy, MRI, and many other imaging modalities. 
With incredible speed and flexibility, Amira software enables advanced 3D imaging workflows for specialists in research areas ranging from molecular and cellular biology to neuroscience and bioengineering. "

has topic
Amira's interface
Description
-
need a thumbnail
Description

MATLAB is famous, so this page is only for being the landing page for components and workflows.

Matlab logo
Description

Columbus is a combination of an image database (based on Omero, OME) and an image analysis engine based on Acapella (PerkinElmer). It is dedicated to cell culture based high content screening data and is used via a web interface. It provides a set importers for automated microscopes such as Yokogawa CellVoyager, PerkinElmer Operetta, PerkinElmer Opera and data in Metamorph format. After login, Images can be explored in a standard web browser by clicking on a well plate view. Image analysis workflows can be developed by combining modules like "find nuclei", "find cytoplasm", "find spots" for object detection. Objects can have a hierarchical structure, e.g. spot objects can be part of a cell object. The approach of workflow design is similar to the freeware cell profiler, but more restricted (less functions and less parameters to tweak) and easier to use. Mutliple intensity- and shape based features can be calculated from detected objects (e.g. texture: haralick, Garbor, SER). Objects can be classified by these features by using hard thresholds or by supervised machine learning. Analysis workflows and results are stored in the database and can be exprted as csv tables for secondary analysis. Simple secondary analysis workflows can be also applied in Columbus directly. Results can be visualized as heatmaps on the plate view. The HCS statistics software Genedata Screener Assay Analyzer can be directly connected to the database.

Columbus screenshot
Description
The Matlab Computer Vision System Toolbox extends the Matlab core functionality with general purpose image processing functions for feature detection & extraction, object detection & tracking and motion estimation. Strengths: - Most functions extend to nD - optimized functions (muti-threaded for some) - Matlab community (Matlab central) - relatively low entry-threshold for functionality - Tutorials & Webinars Limitations: - no embedded visualization of nD Microscopy data
need a thumbnail
Description
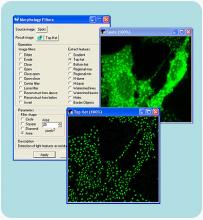
The Matlab image processing toolbox extends the Matlab core functionality with general purpose image processing capabilities. This ranges from image access (read / write), common filters (convolution, morphology, order based, Wiener, feature extraction, image enhancement, ...), image transformation (rotation, affine transformation, ...) to segmentation algorithms (thresholding, watershed, region growing). There is also an extensive list of functions to deal with binary or label mask and perform for instance connected particle analysis or morphological operations. Strengths: - Most functions extend to nD - optimized functions (muti-threaded for some) - Matlab community (Matlab central) - relatively low entry-threshold for functionality - Tutorials & Webinars Limitations: - no embedded visualization of nD Microscopy data
need a thumbnail
Description

Imaris is a software for data visualization, analysis, segmentation and interpretation of 3D and 4D microscopy images. It performs interactive volume rendering that lets users freely navigate even very large datasets (hundreds of GB). It performs both manual and automated detection and tracking of biological “objects” such as cells, nuclei, vesicles, neurons, and many more. ImarisSpots for example is a tool to detect “spherical objects” and track them in time series. Besides the automated detection it gives the user the ability to manually delete and place new spots in 3D space. ImarisCell is a tool to detect nuclei, cell boundaries and vesicles and track these through time. ImarisFilament is a module that lets users trace neurons and detect spines. For any detected object Imaris computes a large set of statistics values such as volume, surface area, maximum intensity of first channel, number of vesicles per cell etc. These values can be exported to Excel and statistics software packages. The measurements can also be analyzed directly within ImarisVantage which is a statistics tool that provides the link back to the 3D objects and the original image data. Strengths: - good visualization - user friendly interface - reads most microscopy file formats - image analysis workflows are very easy to apply - interactive editing of objects to correct errors during automatic detection - large data visualization (hundreds of GB)

has topic
null
Description
Definiens is a commercial image segmentation and classification tool. The user designs a signal processing workflow by combining built-in filtering, thresholding and object classification modules. Object detection is typically done on hierarchical object levels, e.g cell level for cell objects and organelle level Nucleus and ER obejcts inside a cell object. For each object, a huge set of features (shape-based, intensity based, relations to neighbor objects...) is available and can be used for object classification or merging with neighboring objects. The classical definiens workflow is the so called bottom-up approach: In a first step, the image is segmented in numerous small objects, resulting in a heavy oversegmentation of of the target objects. Objects are then fused step by step on basis of features like “relative border to neighbor object” or “elliptic fit of resulting (fused) object”. Objects can assigned to different classes (like “nucleus” or “cancer cell”), based on their features. Weaknesses: -complex to use -closed (no API) -very expensive -relatively slow (you have to buy one license for each core) -bad 3D-visualization -time lapse analysis is possible but complicated Strengths: -powerful method to classify objects based on multiple features -2D data, especially histological data -good training material to learn software usage -detailed documentation
need a thumbnail