Windows

Description

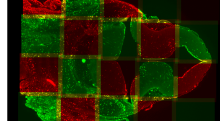
It stitches 3D tiles from terabyte-size microscopy datasets. Stitching does not require any prior information on the actual positions of the tiles, sample fiducials, or conversion of raw TIFF images, and the stitched images can be explored instantly.

MosaicExplorerJ was specifically designed to process lightsheet microscopy datasets from optically cleared samples. It can handle multiple fluorescence channels, dual-side lightsheet illumination and dual-side camera detection.

Description

 This ImageJ function automatically or interactively sets lower and upper threshold values, segmenting grayscale images into features of interest and background.

has function
need a thumbnail
Description

The authors present an ImageJ-based, semi-automated phagocytosis workflow to rapidly quantitate three distinct stages during the early engulfment of opsonized beads.

Description

FluoGAN is a fluorescence image deconvolution software combining the knowledge of acquisition physical model with gan. It takes a fluctuating sequence of blurred, undersampled and noisy images of the sample of interest  fixed sample as input from wide field or confocal and returns a super resolved image.

FluoGan
Description


Relate is a correlative software package optimised to work with EM, EDS, EBSD, & AFM data and images.  It provides the tools you need to correlate data from different microscopes, visualise multi-layered data in 2D and 3D, and conduct correlative analyses.

  • Combining data from different imaging modalities (e.g. AFM, EDS & EBSD)

  • Interactive display of multi-layer correlated data

  • Analytical tools for metadata interrogation

  • Documented workflows and processes

Correlate

  • Import data from AZtec using the H5oina file format
  • Import AFM data
  • Correlate both sets of data using intuitive image overlays and image matching tools
  • Produce combined multimodal datasets

Visualise

  • 2D display of multi-layered data
  • 3D visualisation of topography combined with AFM material properties, EM images, and EDS & EBSD map overlays
  • Customisation of colour palettes, data overlays, image rendering options, and document display
  • Export images and animations

Analyse

  • Generate profile (cross section) views of multimodal data
  • Measure and quantify data across multiple layers
  • Analyse areas via data thresholding using amount of x-ray counts, phase maps, height, or other material properties.
  • Select an extensive range of measurement parameters
  • Export analytical data to text or CSV files
Relate analysis workflow example