Spot detection

Synonyms
Seed point detection
Description

Download the protocol,use and modify in Icy. It permits to detect spot with wavelet spot detector block. Input : loop on a folder Outputs: excel, binary, and detection screenshot

has function
need a thumbnail
Description

Oufti (previously named MicrobeTracker) is a MATLAB application / suite of tools for analysing fluorescent spots inside microbes. MicrobeTracker can identify cell outlines and fluorescent foci, and generate plots and statistics based on positions and intensity (kymographs, histograms etc.) The MATLAB code is easy to modify and extend to add additional plots and statistics: see e.g. Lesterlin et al. (2014).

The Outfi Forum is quite active.

Description

The macro segments and classifies human spermatozoids nuclei (DAPI) based on the number of FISH signals (spots) they contain. It reports the percentage of occurrences of user defined classes (combinations of spot multiplicity in the FISH channels) as well as the position (point selections) of the detected nuclei falling in these classes. The input image should be an hyperstack with 4 channels: DAPI (first channel) and three FISH channels. The images are typically obtained as a maximum intensity projection of few channels (confocal) or a single z slice acquisition (widefield).

Example image available in the linked page. 

has function
Description

Quote:

This pipeline shows how to identify smaller objects (foci) within larger objects (nuclei) and how to use the Relate module to establish a relationship between the two as well as perform per-object aggregate measurements (such as number of foci per nucleus). Sample images are included in the download package.

Description

WASH, Exo84, and cortactin spot detection and codistribution analysis To detect endosomes, an automatic Otsu threshold is applied to the Gaussian-filtered MT1-MMP–positive endosome image (= 1.5 pixels for the sample image). Statistics about each endosome are then saved, for example random positioning of spots can be compared to actual positioning. For each endosome, WASH and Exo84 (or WASH and cortactin) spots are searched for in a neighboring of x pixels in their respective channel. Their number and position are saved per endosome (**see the macro in Text file S2 downloadable from here**).

From the position of WASH and Exo84 (or WASH and cortactin) spots around each endosomes, each WASH spot is paired with its closest Exo84 (or cortactin) spot neighbor, optimized over all spots around this endosome.

This allowed measuring of the distribution of distance between WASH-Exo84 (or WASH-cortactin) spots (**for the co-distribution analysis, see matlab scripts in Zip file S3 downloadable).

endosomes and spot neighbors
Description
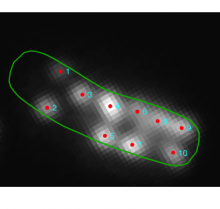
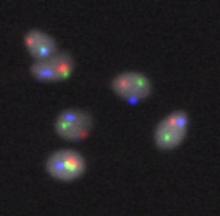
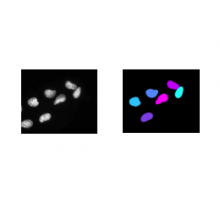
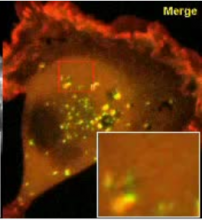
<p>Particle detection is based on "Analyze Particles" in ImageJ. It probably could also be used in spot detection, not limited to centromere. &gt;This macro is described in Bodor et al. (2012). The macro recognizes centromere or kinetochore foci in Delta Vision or TIFF images and determines their centroid position. Fluorescent intensities are then measured for each centromere by placing a small box around the centroid position of the centromere. The peak intensity value within the box is corrected for local background by subtraction of the minimum pixel value. This process results in an accurate measurement of large numbers of centromere or kinetochore-specific signals. Following papers uses CRaQ (picked up, maybe more): - [Fachinetti et al. (2017)](https://www.cell.com/developmental-cell/pdf/S1534-5807(16)30909-1.pdf), Developmental Cell 40, 104–113, - [Guo et al. (2017)](https://www.nature.com/articles/ncomms15775) Nature Communications volume 8, Article number: 15775 (2017) doi:10.1038/ncomms15775 - [Lgosdon et. al. (2015)](http://jcb.rupress.org/content/208/5/521) J Cell Biol Mar 2015, 208 (5) 521-531; DOI: 10.1083/jcb.201412011 - [Bodor et al. (2014)](https://www.ncbi.nlm.nih.gov/pmc/articles/PMC4091408/), eLife. 2014; 3: e02137</p>
has function
Description

This workflow estimates (densely distributed) object counts by the density of objects in the image without performing segmentation or object detection. Current version only works for 2D images of roundish objects with similar sizes on relatively homogeneous background. Users should provide a few labels of background and objects (especially on clustered objects), and the tool predicts the density of objects on the entire image. Counting is then estimated by integrating the density values on the whole image or specified rectangular regions of interests.

need a thumbnail
Description

A set of classes and functions which can be used by plugins performing spot detection and spot tracking.

need a thumbnail
Description

An ImageJ plugin for evaluate intra-nuclear 3D cross-distances between fluorescent spots in multi-channel images ![image](http://bigwww.epfl.ch/sage/soft/spotdistance/meta/splash.png)

has function
need a thumbnail