Spot detection

Synonyms
Seed point detection
Description

Quote: "The GDSC ImageJ plugins are a collection of analysis programs for microscopy images including colocalisation analysis and peak finding (FindFoci)."

Many types of analysis besides simply finding foci detection (spot detection) is bundled in this plugin. One prominent function is "FindFoci Optimizer". This allows feeding images with spot annotation by the user (multi-point selection tool) and scans through various parameter combinations to find the best parameter set that gives the results similar to the annotation. This is almost like machine learning... but with well-established parameter types that allows you to fully understand what is going on.

Description

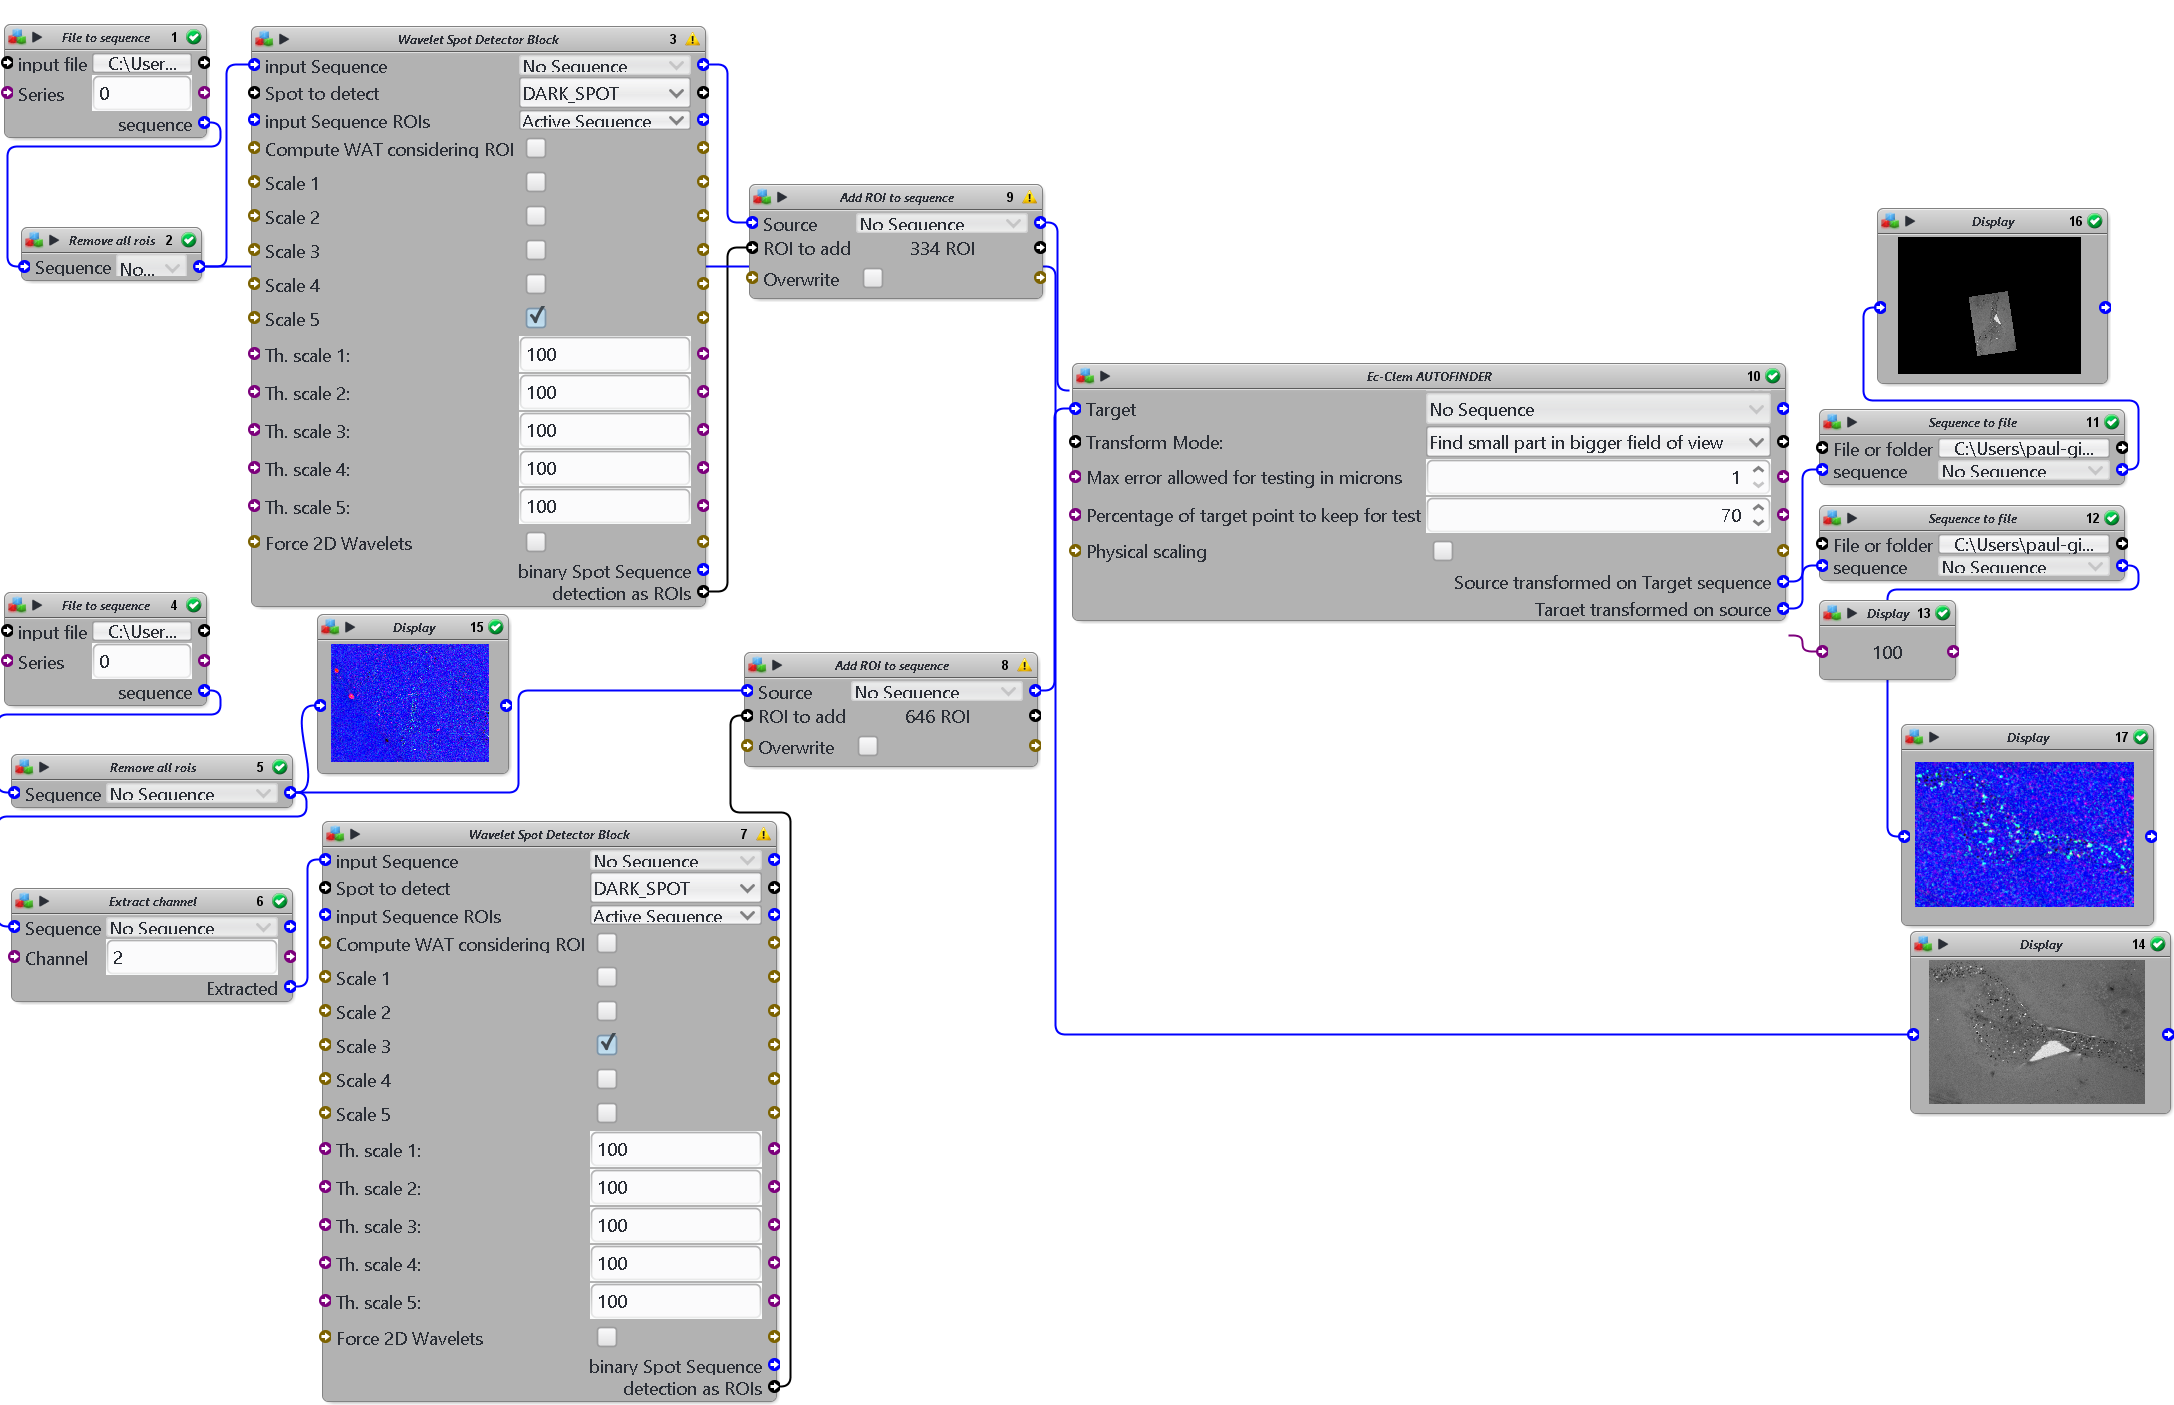
This is an example workflow of how to perform automatic registration by

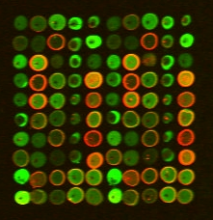
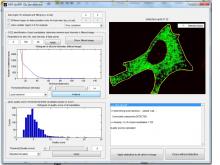
- first detecting spots in both images using wavelet segmentation (with different scale according to the image scale)

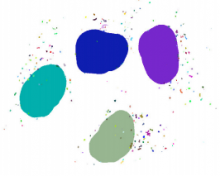
- second using Ec-Clem autofinder to register both images

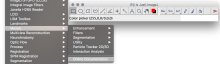
Click on a block to know more about a tool. Non referenced tools are non clickable.

testWorkflowtestWorkflowtestWorkflowimage map example
Workflow results
Description

Spot detector detects and counts spots, based on wavelet transform.

- Detects spots in noisy images 2D/3D.
- Depending on objective, spots can be nuclei, nucleus or cell
- Versatile input: sequence or batch of file.
- Detects spot in specific band/channel.
- Multi band labeling: automaticaly creates ROIs from one band and count in the same or an other band.
- Filters detection by size.
- Sort detection by ROIs
- Output data in XLS Excel files: number of detection by ROIs, and each detection location and size.
- Outputs withness image with ROIs and detection painted on it.
- Outputs binary detection image.
- Displays detections
- Displays tags

logo spot detector
Description

Image-processing algorithms developed at the MOSAIC Group for fluorescence microscopy. Tools included:

  • 2D/3D single-particle tracking tool which can be used to track bright spots in 2D/3D movies over time.
  • Optimal filament segmentation of 2D images. 
  • Curvature filters for image filtering, denoising, and restoration. 
  • Image naturalization for image enhancement based on gradient statistics of natural-scence images. 
  • Tool for automatically send and distribute jobs on clusters and get back the results.
  • Multi-region image segmentation of 2D and 3D images without needing to know the number of regions beforehand. 
  • Squassh for globally optimal segmentation of piecewise constant regions in 2D and 3D images and for object-based co-localization analysis. 
  • Tool for inferring spatial interactions between patterns of objects in images or between coordinates read from a file.
  • Tool for robust, histogram-based background subtraction well suited to correct for inhomogeneous illumination artifacts.
  • A tool to estimate the Point-Spread Function of the microscopy out of 2D fluorescence images.
  • A tool to measure the 3D Point-Spread Function of a confocal microscope from an image stack.
  • Addition of synthetic Poisson-distributed noise to an image in order to simulate shot noise of various signal-to-noise ratios. 
  • Convolution of an image with a Bessel function in order to simulate imaging with a microscope. 
  • A utility to detect bright spots in images and estimate their center. 
  • A utility to create manual segmentations to be used as ground truth to test and benchmark automatic segmentation algorithms.
  • A tool for replacing one color in an image with another color.
has topic
Description

The FindFoci plugins allow the identification of peak intensity regions within 2D and 3D images. The algorithm is highly configurable and parameters can be optimised using reference images and then applied to multiple images using the batch mode. Details of the benefits of training an algorithm on multiple images can be found in the FindFoci paper: 2591

has function
need a thumbnail
Description

Quote: *A GUI-based program which manually detects spots and places them into previously detected meshes. Currently the program runs from MATLAB only. *

need a thumbnail
Description

In this case study, MATLAB, the Image Processing and Signal Processing toolboxes were used to determine the green intensities from a small portion of a microarray image containing 4,800 spots. A 10x10 pattern of spots was detected by averaging rows and columns to produce horizontal and vertical profiles. Periodicity was determined automatically by autocorrelation and used to form an optimal length filter for morphological background removal. A rectangular grid of bounding boxes was defined. Each spot was individually addressed and segmented by thresholding to form a mask. The mask was used to isolate each spot from surrounding background. Individual spot intensity was determined by integrating pixel intensities. Finally, integrated intensities were tabulated and saved to a data file for subsequent statistical analysis to determine which genes matter most.

Description

Matlab toolbox to analyze single molecule mRNA FISH data. Allows counting the number of mature and nascent transcripts in 3D images. See 2513. Following toolboxes are required: - Optimization toolbox - Statistics toolbox - Image processing toolbox - (Optional) Parallel processing toolbox


Input data type: 3D image

Output data type: CSV

has function
Description

Quote:

Fluorescence in situ hybridization (FISH) is used to study the organization and the positioning of specific DNA sequences within the cell nucleus. Analyzing the data from FISH images is a tedious process that invokes an element of subjectivity. Automated FISH image analysis offers savings in time as well as gaining the benefit of objective data analysis. While several FISH image analysis software tools have been developed, they often use a threshold-based segmentation algorithm for nucleus extraction. As fluorescence signal intensities can vary significantly from experiment to experiment, from cell to cell, and within a cell, threshold based segmentation is inflexible and often insufficient for automatic image analysis, leading to additional manual extraction and potential subjective bias. To overcome these problems, we developed a graphical software tool called FISH Finder to automatically analyze FISH images that vary significantly. By posing the nucleus extraction as a classification problem, compound Bayesian Classifier is employed so that contextual information is utilized, resulting in reliable classification and boundary extraction. This makes it possible to analyze FISH images efficiently and objectively without adjustment of input parameters.

has function
Description

These two KNIME workflow solutions are similar: first one detects nuclei and spots inside the nuclei without taking care of surrounding regions, i.e. mitochondria. The second one provides the full solution including spots in mitochondria.

see section 2.4 for KNIME workflow. Section 2.3 is also available, using Fiji. 

Sample image: hela-cells.tif (674k x 3)

has function