Description
There are many methods in bio-imaging that can be parametrized. This gives more flexibility
to the user as long as tools provide easy support for tuning parameters. On the other hand, the
datasets of interest constantly grow which creates the need to process them in bulk. Again,
this requires proper tool support, if biologist is going to be able to organize such bulk
processing in an ad-hoc manner without the help of a programmer. Finally, new image
analysis algorithms are being constantly created and updated. Yet, lots of work is necessary to
extend a prototype implementation into product for the users. Therefore, there is a growing
need for software with a graphical user interface (GUI) that makes the process of image
analysis easier to perform and at the same time allows for high throughput analysis of raw
data using batch processing and novel algorithms. Main program in this area are written in
Java, but Python grow in bioinformatics and will be nice to allow easy wrap algorithm written
in this language.
Here we present PartSeg, a comprehensive software package implementing several image
processing algorithms that can be used for analysis of microscopic 3D images. Its user
interface has been crafted to speed up workflow of processing datasets in bulk and to allow
for easy modification of algorithm’s parameters. In PartSeg we also include the first public
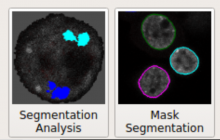
implementation of Multi-scale Opening algorithm descibed in [1]. PartSeg allows for
segmentation in 3D based on finding connected components. The segmentation results can be
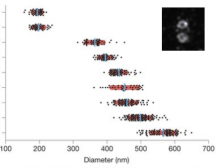
corrected manually to adjust for high noise in the data. Then, it is possible to calculate some
standard statistics like volume, mass, diameter and their user-defined combinations for the
results of the segmentation. Finally, it is possible to superimpose segmented structures using
weighted PCA method. Conclusions: PartSeg is a comprehensive and flexible software
dedicated to help biologists in processing, segmentation, visualization and the analysis of the
large microscopic 3D image data. PartSeg provides well established algorithms in an easy-touse,
intuitive, user-friendly toolbox without sacrificing their power and flexibility.
Examples include Chromosome territory analysis.