Image deconvolution

Description

A deconvolution component applicable to confocal and STED microscopy. The MATLAB function fo this package implements the SGP method for n-dimensional object deblurring with the option of boundary effects removal. Although this is a preliminary version, results seem to be good from their paper (Zanella et al 2013).

has function
Description

The overall colors seen in H&E stained slides can vary widely, influenced by factors such as the precise stains and scanner used. This MATLAB function implements the color normalization strategy described in Macenko et al (2009) in order to match stain colors in an image more closely to 'reference' stains. This may help when comparing images visually, or when applying an automated analysis algorithm.

The function may also be useful to understand the functioning of the color deconvolution described in Ruifork and Johnston (2001).

has topic
has function
Description

Analyzing ER, PR, and Ki-67 immunohistochemistry

ImmunoRatio is an ImageJ plugin to quantify haematoxylin and DAB-stained tissue sections by measuring the percentage of positively stained nuclear area (labeling index), described in [bib]2452[/bib].

Notes for use:

  • It is important to read the URL instructions and original paper to understand what is being measured. In particular, the primary measurement made is percentage of the total nuclear area, not the percentage of detected nuclei (the latter being the more common method of assessing e.g. Ki67). This may be further modified by the Result correction equation.
  • Ultimately ImmunoRatio relies on thresholding (color deconvolved [bib]2451[/bib]) images to define 'nucleus' vs 'non-nucleus' regions according to staining intensity. Therefore dark artefacts, such as tissue folds, are likely to cause errors.
  • The pixel size is not read automatically from the image, but rather the source image scale should be entered into the dialog box - and the image rescaled accordingly prior to analysis. This scale value is the inverse of the value normally found for pixel width and pixel height under Image -> Properties... (i.e. pixel width & height are given in microns per pixel; the dialog box asks for pixels per micron).

Web application: ImmunoRatio

Example Image: Sample ImmunoRatio results

References

  1. [2452] Tuominen VJRuotoistenmäki SViitanen AJumppanen MIsola J.  2010.  ImmunoRatio: a publicly available web application for quantitative image analysis of estrogen receptor (ER), progesterone receptor (PR), and Ki-67.. Breast Cancer Res. 12(4):R56.
  2. [2451] Ruifrok ACJohnston DA.  2001.  Quantification of histochemical staining by color deconvolution.. Anal Quant Cytol Histol. 23(4):291-9.
has topic
has function
Description

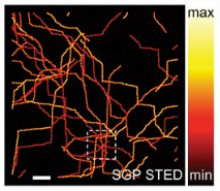
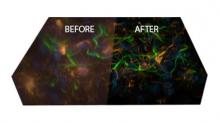
The Huygens Software Suite consists of different image processing packages with functionalities that include deconvolution, interactive analysis, and volume visualization of 2D-3D multi-channel and time series images from fluorescence microscopes such as widefield, confocal, multi-photon, spinning disk, Array Detector, STED, and Light Sheet

Description

Deconvolution software

has function
Image restoration with AutoQuant